Sovereign Health and Trust Dashboard
This example shows the v0.17.5 read-only sovereign dashboard. The dashboard turns local protocol state into an operator-facing health and trust summary: readiness, treaty lifecycle risk, revocation-feed freshness, recent trust changes, and links back to raw JSON.
It is intentionally a view only. It does not create treaties, import feeds, grant trust, or execute browser admin actions.
Flow
        sequenceDiagram
    participant OP as Operator
    participant D as /dashboard
    participant DB as Local NA state
    participant J as Raw JSON

    OP->>D: Open read-only dashboard
    D->>DB: Read health, treaties, feeds, audit
    D-->>OP: Health, warnings, lifecycle, freshness
    OP->>J: Open /dashboard.json or /connectome.json
    J-->>OP: Machine-readable source view
What This Proves
A fresh sovereign has clear empty states.
Connected sovereigns show treaty lifecycle state and expiry risk.
Imported revocation feeds show freshness based on local import time.
Recent trust-state changes are visible without exposing secrets.
Operators can jump from the page to raw JSON and CLI/API references.
The dashboard remains read-only and does not mutate trust.
Live Recording
Live Network Authority screenshot:
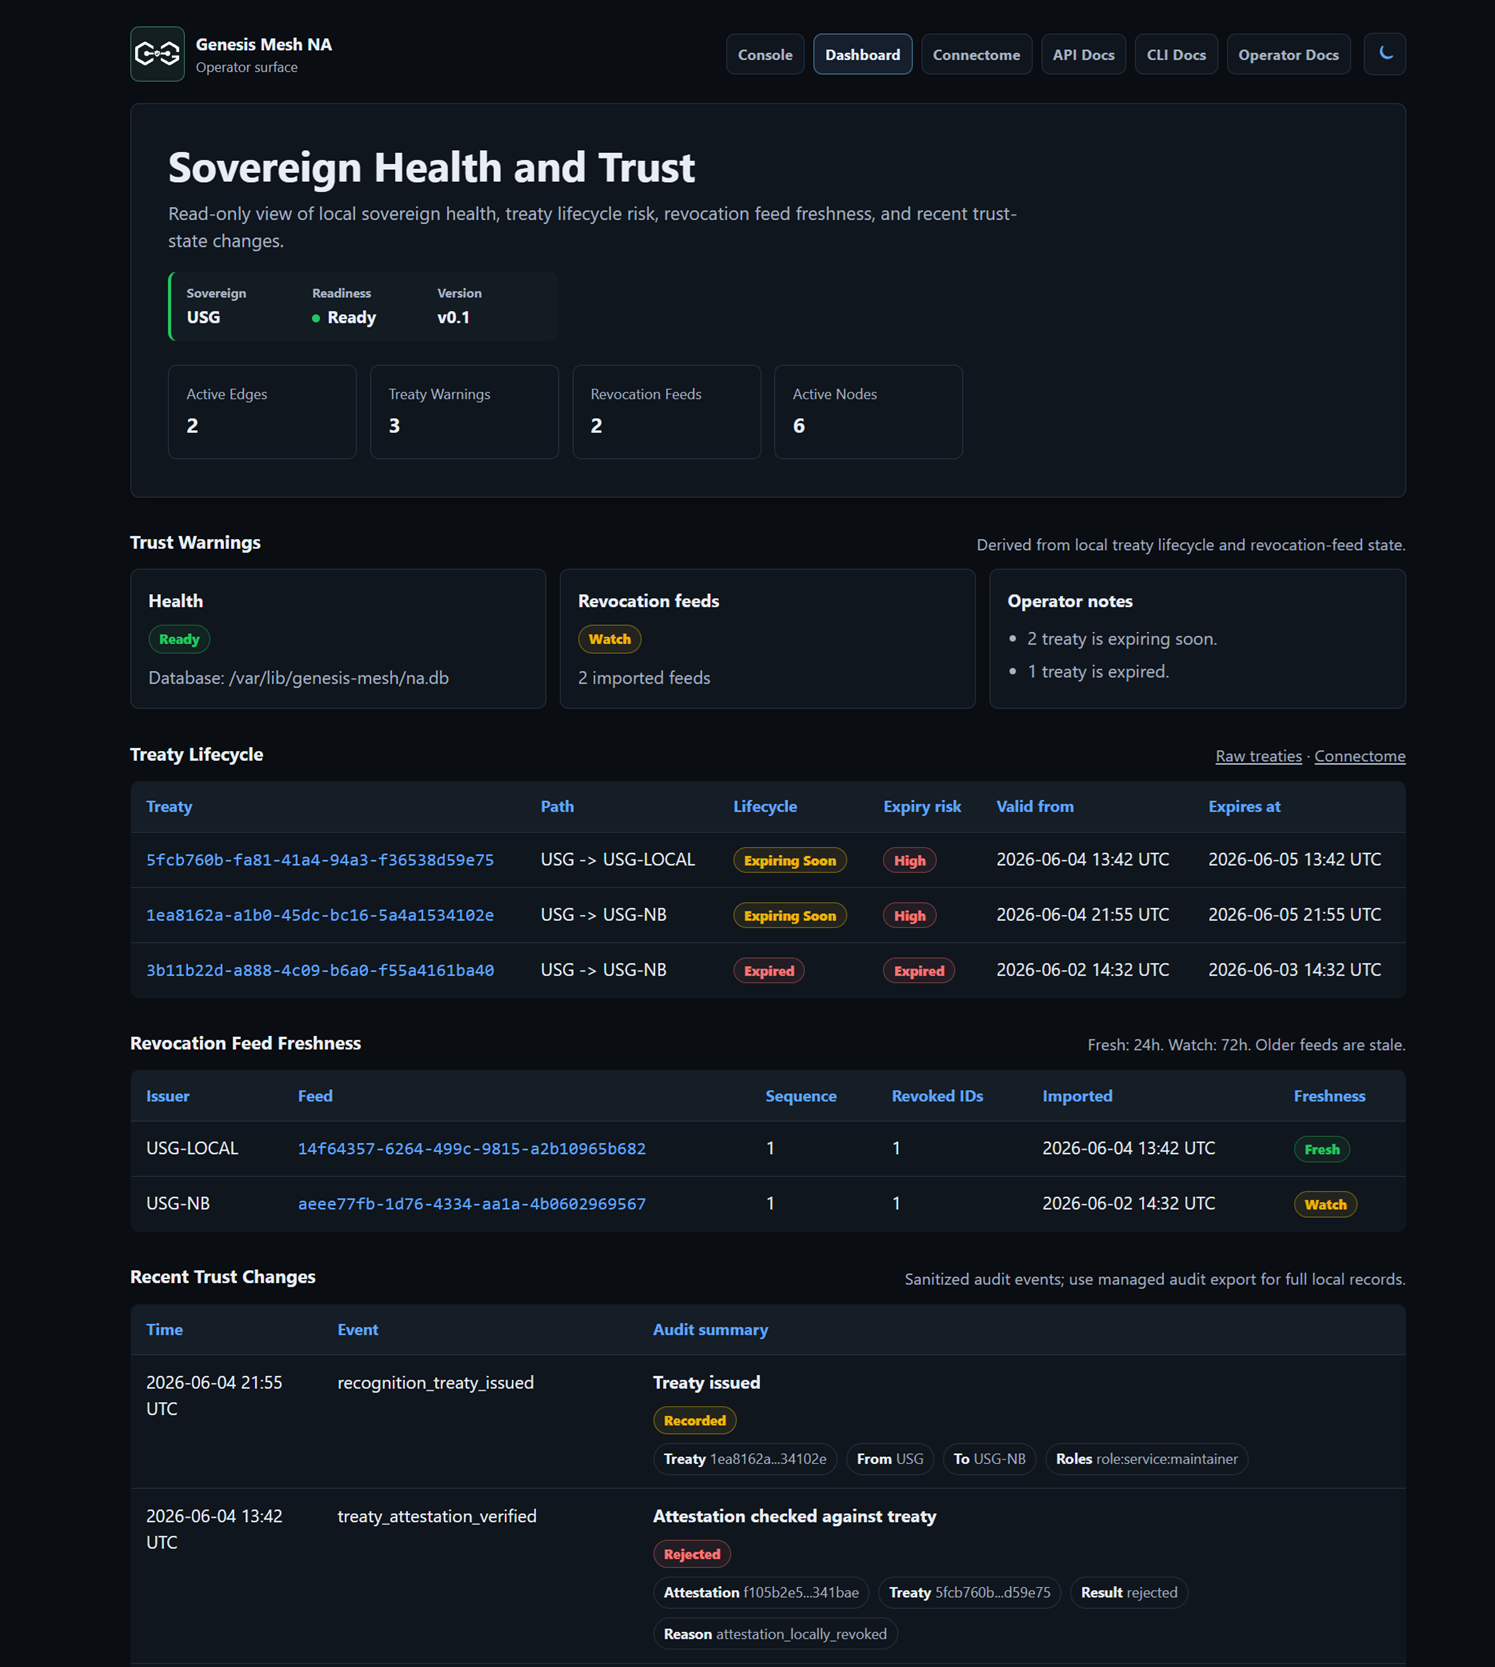
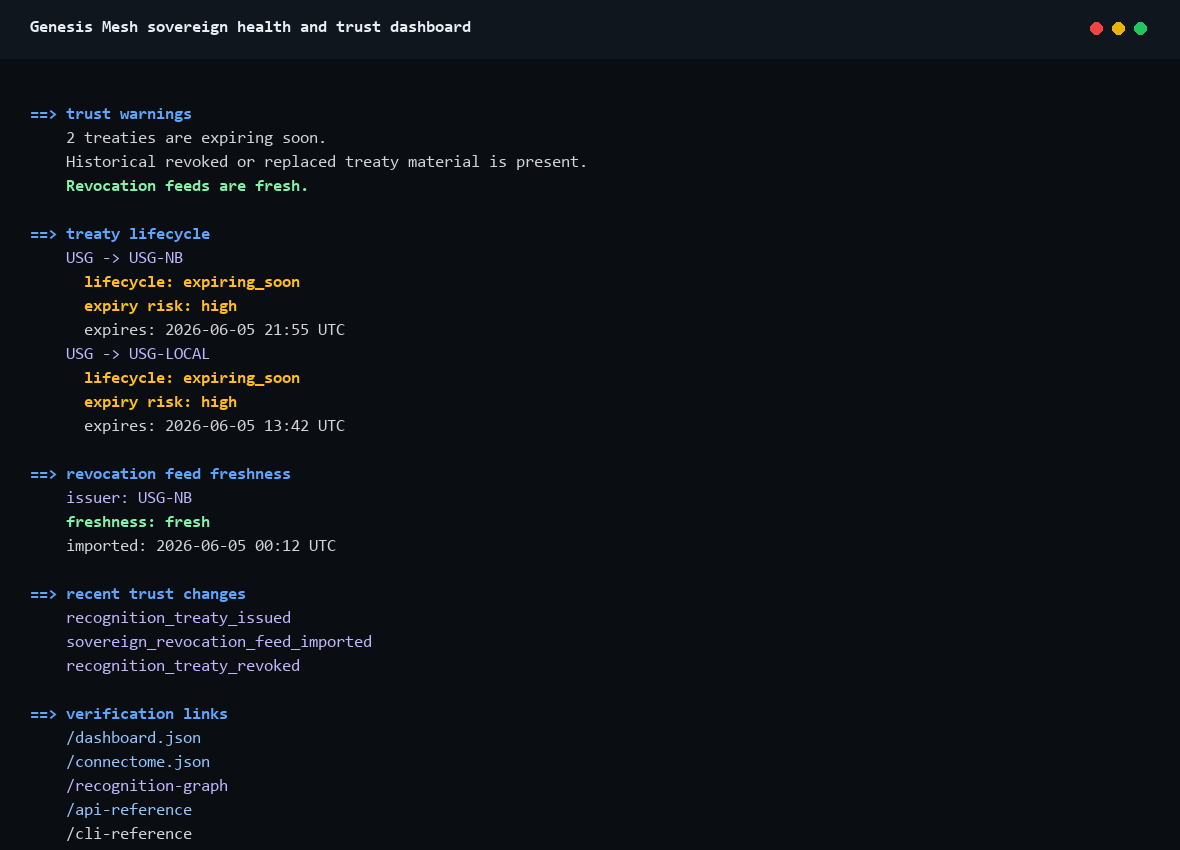
The screenshot above shows the deployed dashboard with treaty warnings, revocation-feed freshness, and human-readable trust-change summaries. The generated recording below remains the repeatable local demo asset.
Static screenshot:
Run
Generate the documentation assets from the captured transcript:
python docs\examples\assets\scripts\sovereign-health-dashboard-demo.py
Open the live dashboard:
curl -fsS https://na.genesismesh.connectorzzz.com/dashboard
curl -fsS https://na.genesismesh.connectorzzz.com/dashboard.json